
It is not just low voter numbers, but
look closer at the numbers themselves and you will see the huge gaps reflecting
who votes and who doesn’t based on income and ethnicity. Not only did a small
number of people elect the political leaders last year, but those small number
were the whitest and the wealthiest.
I have been tracking and analyzing and
commenting on voter disparities and we were a partner at the recent Voting Is
Power Summit where our report was part of the report given on voting and civic
health and physical and mental health disparities and the connections between
them all. You can see all the details at our website www.athirdplace.org under the community
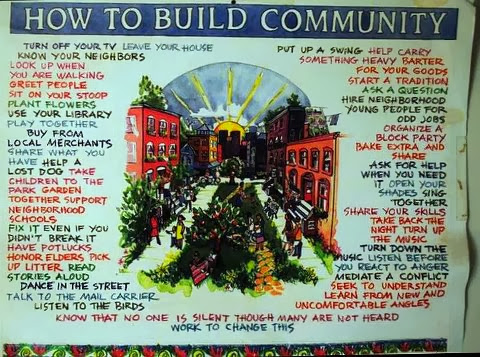
blog posts on voting. Here is a quick summary to go along with the meme map
going around.
Our area of Tulsa’s northside is part
of the low life expectancy high poverty zipcodes. In our two mile service area
radius of far north we have 7 precinct polling places. They cover some or all
of four zipcodes; first this compares to one zipcode in south Tulsa, 74133,
which has 15 precinct polling places just within its one zipcode. Distance to
polling places is further apart for those who are poorer and with fewer
transportation options.
In our immediate 7 precinct area, there were only 2,036
votes cast (of these the losing candidate for Governor, the Democrat, won by
1,723 to 263, or with 84.6 percent; compare that with Tulsa County’s 40.3
percent to the Democrat (the Repubican victor has 56.9 percent county wide).
The vast majority which did vote voted for the losing candidate, with the
resulting effect of less political influence, voice, representation of
concerns, etc. That 2,036 vote reflects 25.1 percent of registered voters in
the 7 precincts, or only one out of four registered voters (not to mention, as
the facebook meme does, the total number of adult citizens eligible to vote).
The2,036
vote turnout in our total 7 precincts in our service boundaries, with some of
the lowest percentage turnout, also compares to the eight precincts in just the
one midtown zip code, 74114, which has the highest percentage turnout, and
highest life expectancy, and which cast 5,379 votes. That is 63 percent more
votes cast in one zipcode than in all of the all or parts of four zipcodes in
our far north area. My precinct in far north Tulsa in the 74126 had the lowest
turnout percentage, 20 percent, or only one in five registered in our precinct;
compared to one precinct in the 74114 which had almost 50 percent turnout (thirty
percent turnout gap) and the whole 74114 zipcode with its eight precincts had a
turnout rate of 45.5 percent. There is an ethnic component as well. The 74126,
and particularly my precinct in it,
precinct nine, has one of the highest African American percentages of
Tulsa zipcodes, while The 74114 has one of the highest white percentages.
Looking beyond our far north context
to all of North Tulsa: there are another 21 precincts in all of North Tulsa for
a total of 28 precincts for North Tulsa compared to 177 total for Tulsa (not
counting the ones covering other cities and areas in Tulsa County as a whole,
but just concentrated in the city limits basically). That gives North Tulsa some 16 percent of the
total number of precincts for the approximate whole city area; or the other
three geographic sides of the city have 84 percent of the voting precincts, and
so even with a much higher voter turnout on the northside, if there is a
concurrent higher vote turnout elsewhere in the city will result in the
northside continuing to be statistically left out of city-wide issues and votes
(not to mention voting on the losing side of issues and elections). That
reality feeds the cynicism and despair which feeds, among other factors, the
low turnout.
Overall
North Tulsa area, mostly incorporated city of Tulsa but includes some
unincorporated adjacent to Tulsa City and includes the areas of northeast Tulsa
where there is a higher white percentage than in near North and far North
sections, there is An overall Total of 30,197 registered voters. Of that amount, 8,199 voted, or 27.1 percent turnout, a little more
than one in four.
By the
way, That most populous zipcode, the 74133 in south Tulsa, with 15 precincts in
it alone, accounts for 20,505 registered voters (that alone equals two thirds
of the total vote in all of North Tulsa); and in the latest election, in the
74133 zip, some 7,760 voted; if just 439 more people had voted in the 74133 of
south Tulsa then it would have equaled the total vote turnout for ALL of North
Tulsa zipcodes.
As is, its turnout amounted to 37.8 percent of those registered
in the 74133 zipcode; that ten percent gap higher than all of North Tulsa turnout,
and almost 13 percent higher than far north turnout, is less overall than the
thirty percent gap between the highest and lowest precinct turnout, but it is
still significant.
Raising
consciousness is the first part of the response; this is mostly what this
analysis does. Looking at a wide variety of reform measures, and improving the
civic health of North Tulsa in general, is where to turn next. Better Voter
information, better transportation options, more polling places in high poverty
areas, uniform polling places in each part of town open to any regardless of
where they live, mobile polling places, allowing more felons to vote and more
publicity to let eligible felons know they can register and vote already,
default registration, and a host of other reform initiatives working in others
areas.
No comments:
Post a Comment